Condensed Interim Financial Statements For the six months ended 30 September 2025
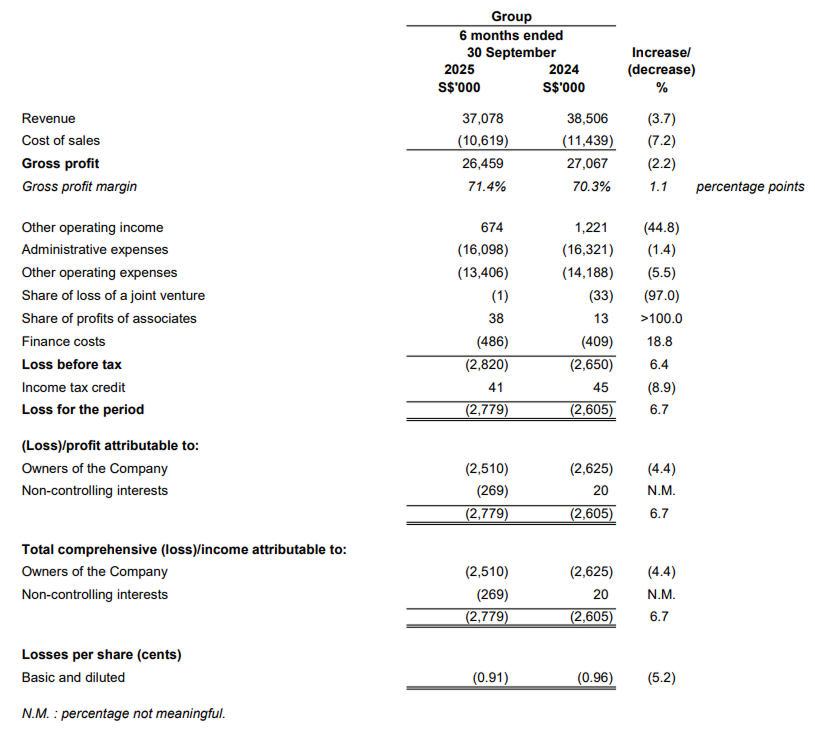
Condensed Interim Consolidated Income Statement And Statement Of Comprehensive Income For the Financial Period ended 30 September 2025
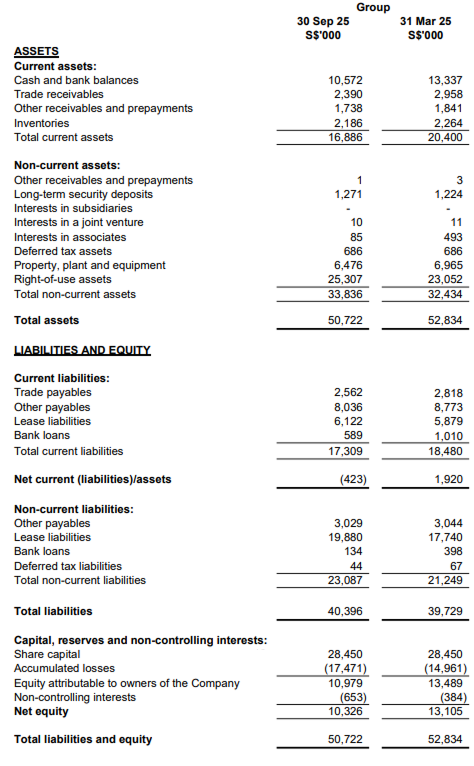
Condensed Interim Statements Of Financial Position
Review of the performance
Revenue
Gross profit margin
Gross profit decreased by S$0.6 million (2.2%) to S$26.5 million in HY26 from S$27.1 million in HY25, in line with the lower revenue recorded in HY26. Gross profit margin increased by 1.1 percentage points to 71.4% in HY26 from 70.3% in HY25 due to better control of food costs.
Other operating income
Other operating income decreased by S$0.5 million (44.8%) to S$0.7 million in HY26 from S$1.2 million in HY25 mainly due to:
- S$0.3 million lower catering service income and marketing promotion funds received;
- S$0.1 million lower other government grants (Jobs Growth Incentives and Progressive Wage Credit Scheme); and
- S$0.1 million lower interest income earned.
Administrative expenses
Administrative expenses, mainly manpower-related expenses, decreased by S$0.2 million (1.4%) to S$16.1 million in HY26 from S$16.3 million in HY25 due to decrease in headcount by 11, following the closure of outlets in FY25.
Other operating expenses
Other operating expenses decreased by S$0.8 million (5.5%) to S$13.4 million in HY26 from S$14.2 million in HY25. The operating expenses which had decreased in HY26 include depreciation of property, plant and equipment (S$0.2 million decrease), utilities expenses (S$0.2 million decrease), advertising and promotions expenses (S$0.2 million decrease) as well as professional fee (S$0.2 million decrease).
Finance Costs
Finance costs increased by S$77,000 (18.8%) to S$486,000 in HY26 from S$409,000 in HY25 mainly due to increase in interest expenses on lease liabilities driven by higher lease liabilities in HY26.
Share of loss of a joint venture
Share of loss of a joint venture decreased by S$32,000 (97.0%) to S$1,000 in HY26 from S$33,000 in HY25 due to cessation of business operation of the joint venture in FY25.
Share of profits of associates
Share of profits of associates increased by S$25,000 (>100.0%) to S$38,000 in HY26 compared to S$13,000 in HY25 due to net profit contribution from an associate in HY26.
Income tax credit
Income tax credit decreased by S$4,000 (8.9%) to S$41,000 in HY26 from S$45,000 in HY25 mainly due to lower deferred tax benefits recorded in HY26.
Loss attributable to the owners of Company
The Group recorded a loss attributable to the owners of the Company amounting to S$2.5 million in HY26, compared to a loss of S$2.6 million in HY25. The loss was mainly attributable to softened demand amid continued macroeconomic volatility. Nonetheless, the adverse impact was partially cushioned by the Group’s ongoing efforts to enhance operational efficiency and control operating costs.
Cash and bank balances
Decrease in cash and bank balances at Group level was mainly due to:
- S$3.7 million repayment of lease obligations and interest;
- S$0.7 million repayment of bank borrowings; and
- S$0.4 million cash outlays for renovating and acquiring plant and equipment for existing outlets.
This was partially offset by S$1.5 million operational cash inflow, S$0.3 million dividends received from an active associate and S$0.2 million repayment of capital from another two associates that had been struck off in HY26.
Decrease in cash and bank balances at Company level was mainly due to advances to a wholly-owned subsidiary as additional working capital in HY26.
Trade receivables
Decrease in trade receivables at Group level was mainly due to an improvement in receivable turnover days.
Other receivables and prepayments (current)
Decrease in other receivables and prepayments (current) at Group level was mainly due to lower prepayment made for food materials amounting to S$0.3 million but partially offset by increase in prepaid insurance premium amounting to S$0.2 million in HY26.
Increase in other receivables and prepayments (current) at Company level was mainly due to advances of S$0.7 million extended to a wholly-owned subsidiary in HY26.
Inventories
Decrease in inventories at Group level was consequent to lower revenue generated in HY26.
Long-term security deposits
Increase in long-term security deposits at Group level was mainly due to the additional rental and utilities deposits placed in HY26.
Interests in a joint venture
Decrease in interests in a joint venture at Group level was mainly due to share of loss of joint venture amounting to S$1,000 in HY26.
Interests in associates
Decrease in interests in associates at Group level was due to S$280,000 dividend received from an active associate and S$166,000 repayment of capital from another two associates that had been struck off in HY26 but partially offset by share of profits amounting to S$38,000 in HY26.
Property, plant and equipment
Decrease in property, plant and equipment at Group level was mainly due to S$0.9 million depreciation charge but partially offset by acquisition of plant and equipment for existing outlets amounting to S$0.4 million in HY26.
Right-of-use assets
Increase in right-of-use assets at Group level was mainly due to addition of right-of-use assets amounting to S$5.6 million but offset by S$3.4 million depreciation charge in HY26.
Trade payables
Decrease in trade payables at Group level was mainly due to lower credit purchases in tandem with lower restaurant revenue.
Other payables (current)
Decrease in other payables (current) at Group level was mainly due to S$0.6 million decrease in staff-related accrued expenses and decrease in deferred revenue of S$0.1 million in HY26.
Decrease in other payables at Company level was mainly due to reversal of fair value adjustment on financial guarantees of S$68,000 in HY26.
Lease liabilities (current and non-current)
Increase in lease liabilities at Group level was mainly due to S$5.6 million addition of lease liabilities but partially offset by S$3.2 million settlement of lease obligations in HY26.
Bank loans (current and non-current)
Decrease in bank loans at Group level was due to loan repayments of S$0.7 million in HY26.
Non-controlling interests
Decrease in non-controlling interests at Group level was mainly due to share of net losses of S$0.3 million associated with non wholly-owned subsidiaries in HY26.
Total assets
Total assets of the Group decreased by S$2.1 million (4.0%) to S$50.7 million as at 30 September 2025 from S$52.8 million as at 31 March 2025 mainly due to:
- decrease in cash and bank balances of S$2.7 million;
- decrease in trade, other receivables and prepayments of S$0.7 million;
- decrease in property, plant and equipment of S$0.5 million;
- decrease in interests in associates of S$0.4 million; and
- decrease in inventories of S$0.1 million.
This was partially offset by increase in right-of-use assets of S$2.3 million.
Total liabilities
Total liabilities of the Group increased by S$0.7 million (1.8%) to S$40.4 million as at 30 September 2025 from S$39.7 million as at 31 March 2025 mainly due to increase in lease liabilities of S$2.4 million. This was partially offset by:
- decrease in trade and other payables of S$1.0 million; and
- decrease in bank borrowings of S$0.7 million.
Cashflow
The Group's operational cashflow recorded a net inflow of S$1.5 million in HY26 compared to S$1.9 million in HY25. The decrease was mainly due to lower revenue generated in HY26.
The Group's investing cashflow recorded a net inflow of S$0.1 million in HY26 compared to net outflow of S$0.5 million in HY25. The increase was mainly due to dividend received from an active associate and repayment of capital from another two associates that had been struck off in HY26 but offset by the acquisition of plant and equipment for existing outlets in HY26.
The Group’s financing cashflow recorded a net outflow of S$4.3 million in HY26 compared to S$4.8 million in HY25. The decrease was mainly due to the absence of dividend payment to shareholders of the Company in HY26.
Overall, the Group’s cash position decreased by S$2.7 million to S$10.6 million in HY26 from S$13.3 million as of 31 March 2025.
Negative working capital
The Group was in negative working capital position of S$0.4 million as of 30 September 2025 compared to working capital surplus of S$1.9 million as of 31 March 2025. The Directors and the Management are satisfied that, barring any unforeseen circumstances, taking into account the Group’s financial position in terms of the net asset value, available cash and bank balances, availability of credit facilities from banks as well as forecasted net cash inflows from operating activities, the Group will be able to meet its short-term obligations for the next 12 months as and when they fall due.
Commentary on current year prospects
The Group anticipates that persistent geopolitical tensions and global uncertainties will continue to weigh on consumer sentiment, affecting overall market confidence and discretionary spending.
Against this backdrop, the Group remains focused on driving growth through continued product innovation and value-driven ingredient sourcing to align with evolving consumer preferences.
Concurrently, the Group continues to refine its business strategies and accelerate the adoption of digital initiatives to optimise operational efficiency and strengthen its competitive advantage.
Meanwhile, the Group remains committed to maintaining prudent capital management to navigate the prevailing uncertainties and to pursue suitable expansion opportunities judiciously.